In [1]:
import khmer
Introduction
khmer is a toolkit for fast, low-memory examination of k-mers and De Bruijn graphs, as well as manipulation of shotgun sequencing reads.
khmer started with one simple idea: memory efficient storage of k-mers is useful. But, because De Bruijn graphs are based on k-mers, and De Bruijn graphs are one simply and unifying way to look at lots of DNA sequencing data, khmer has grown in utility.
DNA, k-mers, and graphs
Imagine a strand of DNA whose sequence has no repeats at a given k-mer size - that is, for a specific k-mer size (say \(k_0 = 21\)), each k-mer that is present in the strand of DNA occurs exactly once.
If you decrease k from k_0 enough, you will eventually find a repeated k-mer (consider a k of 1). If you increase k beyond k_0, you will never find a repeated k-mer.
You can build an explicit graph from the k-mers in the sequence by constructing nodes from the k-mers and edges between the nodes as k-1 overlaps; this graph can also be built with overlaps as nodes and k-mers as edges.
You can also build an implicit graph from the k-mers by simply recording all of the k-mers, and then dynamically finding all possible neighboring nodes by searching for all k-1 overlaps; for a DNA De Bruijn graph, there are never more than 4 possible prefixes and 4 possible suffixes. For long enough k, there will be no false edges.
The advantage of the implicit graph is that tracking the edges requires memory, while merely tracking the nodes can be done with minimal expense.
- Mention sparseness and k in context of initial paper.
- Discuss distributed, and what “expensive” means.
- Connect to Medjedev paper, and Rizk paper.
The core utility of the De Bruijn graph approach to representing sequence data is that all of the real paths present in the raw data will be paths in the De Bruijn graph, and that these paths can generally be distinguished from paths created by sequencing errors in the sequencing data. We will discuss this below.
Sequencing errors, k-mer inflation, and the error catastrophe
The big weakness in De Bruijn graphs is that they rely on k-mers, and the population of k-mers can inflate quickly with sequencing error.
If you consider a read data set with reads of length 100, and an error rate of 1%, then on average each read will have one error in it. Each error will create up to k novel k-mers, because the erroneous base will be present in every k-mer that overlaps it:
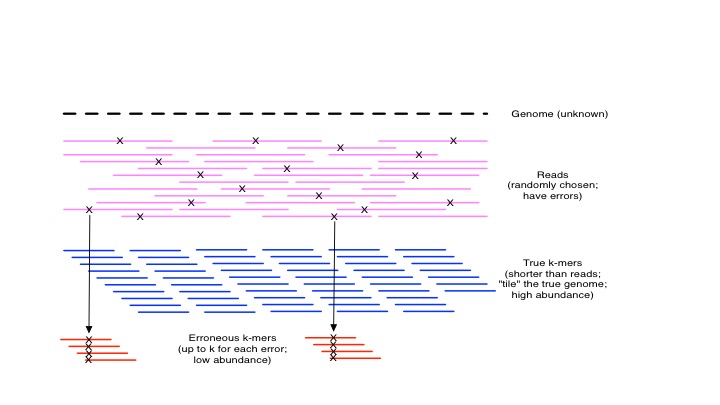
kmers and errors
If you do a first-level analysis (ignoring the possibility of duplicate error k-mers), with a k=21, for each read you will get 21 novel k-mers and 59 repeat k-mers. This inflates quite rapidly to the point where a De Bruijn graph has many more erroneous k-mers in it than “true” k-mers.
Luckily you can use the number of times k-mers show up to distinguish between erroneous and true k-mers. More on that later.
How khmer works underneath
khmer works by storing k-mers, optionally with abundances, in a Bloom filter or CountMin sketch - memory efficient, and fairly fast data structures.
The details are explored in Pell et al., 2012 and Zhang et al., 2014, but the basic idea is to use a hash table to store presence/absence or abundance information without paying attention to collisions.
These data structures are:
- simple - the core ideas of khmer can be reimplemented in under a few dozens lines of simple code.
- fast - most queries involve hashing a few numbers and doing a direct lookup into a large table for each hash.
- memory-efficient: for sparse data sets (where most k-mers are not present), these data structures turn out to be incredibly efficient.
- constant memory: you must allocate the data structures entirely at the beginning.
- online: you can query for the presence/absence and abundance of k-mers at any point.
In exchange we give up a few things:
- exactly correct counting/presence: there will be a one-sided error, a false positive rate, that will show k-mers as being present when they’re not, or more abundant than they actually are.
- elements cannot be directly removed from Bloom filters.
- elements are also anonymous and must be accessed with a handle (that is, you must know what k-mer you are looking for; you can’t retrieve all stored k-mers).
and probably a few other items I’m missing here...
There are a number of approaches we could take to ameliorate the problems, but we have been able to work around the problems so far.
Essentially, the tradeoff is a few cheap/easy operations against loss of generality in the data structure. But, because of the growth of data and the error catastrophe in De Bruijn graphs, discussed above, low memory data structures and fast operations have been practically useful and interesting for real-world data analysis problems.
A hands-on exploration
khmer is written in C++ with a Python wrapping; while the underlying C++ code is directly usable, it’s not very mature. This is because within our group we almost entirely use the Python API. This is what the command-line scripts and all the tests also use.
Below, we explore some of the basic concepts in khmer.
Basic k-mer storage: Nodegraph and Countgraph
To store a k-mer, you first create a Nodegraph or a Countgraph, and give it a k-mer size and some other parameters (discussed below).
Let’s start with a k-mer size of 7:
In [2]:
>>> K = 7
>>> kmer = 'ATGGATG'
A Nodegraph stores the presence or absence of k-mers, without keeping track of their count:
In [3]:
>>> ng = khmer.Nodegraph(K, 1e6, 4)
>>> ng.get(kmer)
0
>>> ng.add(kmer)
>>> ng.get(kmer)
1
>>> ng.add(kmer)
>>> ng.get(kmer)
1
Out[3]:
1
A Countgraph stores the count of k-mers, up to 255 (8 bits).
In [4]:
>>> cg = khmer.Countgraph(K, 1e6, 4)
>>> cg.get(kmer)
0
>>> cg.add(kmer)
>>> cg.get(kmer)
1
>>> cg.add(kmer)
>>> cg.get(kmer)
2
Out[4]:
2
In either case, we can ask for all of the neighboring nodes in the graph, which, in this case, will be none –
In [5]:
>>> cg.neighbors(kmer)
[]
Out[5]:
[]
If we add an adjoining k-mer, though –
In [6]:
>>> cg.add(kmer[1:] + 'G')
>>> cg.neighbors(kmer)
[5555]
Out[6]:
[5555]
we’ll get back a neighbor. Here, the neighbor is represented
numerically; you can get the neighbor back as a string with the
reverse_hash method:
In [7]:
>>> ns = cg.neighbors(kmer)
>>> cg.reverse_hash(ns[0])
'TGGATGG'
Out[7]:
'TGGATGG'
(Note that, because we are dealing with DNA, we collapse forward and reverse-complement k-mers.)
In [8]:
>>> print(cg.hash('TGGATGG'))
>>> print(cg.hash('CCATCCA'))
7967
7967
Working with sequences rather than k-mers
In general, we don’t want to work with individual k-mers - we want to work with sequences of them.
khmer has lots of functions for working with sequences longer than the k-mer size. This starts with consuming them, which loads each k-mer in the sequence into the given table:
In [9]:
>>> K = 21
>>> cg = khmer.Countgraph(K, 1e6, 4)
>>> seq = 'CCCTGTTAGCTACGTCCGTCTAAGGATATTAACATAGTTGCGACTGCGTCCTGTGCTCA'
>>> cg.consume(seq)
Out[9]:
39
You can now do things like ask for the counts of all of the kmers in that sequence (which will be ‘1’, since we’ve only loaded it once...)
In [10]:
>>> cg.get_kmer_counts(seq)
Out[10]:
[1,
 1,
 1,
 1,
 1,
 1,
 1,
 1,
 1,
 1,
 1,
 1,
 1,
 1,
 1,
 1,
 1,
 1,
 1,
 1,
 1,
 1,
 1,
 1,
 1,
 1,
 1,
 1,
 1,
 1,
 1,
 1,
 1,
 1,
 1,
 1,
 1,
 1,
 1]
You can also ask for statistics on the sequence, such as the median, average, and stddev of the k-mer counts in it:
In [11]:
>>> median, avg, stddev = cg.get_median_count(seq)
Where’s the graph, then?
Once you can store k-mers, and find their neighbors, you have the basic necessities for working with graphs of k-mers. This can be used to do a bunch of useful things - for example, assembly.
Here we’ll use a Nodegraph, which doesn’t track counts:
In [12]:
>>> ng = khmer.Nodegraph(K, 1e6, 4)
>>> ng.consume(seq)
Out[12]:
39
If the sequence produces a linear path within the graph (which this one does), we can now traverse it from one end to the other like so:
In [13]:
>>> seed_kmer = 'CCCTGTTAGCTACGTCCGTCT'
>>> ng.assemble_linear_path(seed_kmer)
Out[13]:
'TGAGCACAGGACGCAGTCGCAACTATGTTAATATCCTTAGACGGACGTAGCTAACAGGG'
Note that you can start with any k-mer in the path – above, we started with the first one, but we can also start with one taken from the middle:
In [14]:
>>> seed_kmer = 'CCGTCTAAGGATATTAACATA'
>>> ng.assemble_linear_path(seed_kmer)
Out[14]:
'TGAGCACAGGACGCAGTCGCAACTATGTTAATATCCTTAGACGGACGTAGCTAACAGGG'
We’ll go a little bit more into assembly (and the limitations of these functions) in the section on exploring graphs.
Working with files and sequences
khmer doesn’t care how you get the sequences; it takes in any valid DNA string. We do have some libraries that we’ve built ourselves, though, that make it quite easy.
You can load sequences from files using the screed library. Briefly,
In [15]:
>>> import screed
>>> ng = khmer.Nodegraph(K, 1e6, 4)
>>> for record in screed.open('data/reads.fa.gz'):
...    ng.consume(record.sequence)
This approach gives you lots of easy manipulation of things in Python.
You can also use the built-in function on graph objects,
consume_fasta, which returns the number of reads and the number of
k-mers consumed:
In [16]:
>>> ng = khmer.Nodegraph(K, 1e6, 4)
>>> ng.consume_fasta('data/reads.fa.gz')
Out[16]:
(20000, 1600000)
Both screed and khmer will take FASTA and FASTQ files, plain text or gzipped or bz2-zipped.
Question
How would we use the functionality described so far to characterize the difference in high-abundance k-mers between two data sets?
Revisiting a few pecularities
Because of the memory-efficient way that khmer stores k-mers, the Nodegraph and Countgraph structures don’t actually keep track of the actual k-mer; this means you can’t ask the data structures for a list of the k-mers they contain. So you always have to know what k-mer you’re asking about. In practice, this means you need a starting point.
In each of the examples above, we’ve specified how much memory we’re going to give the graph up front. This is, again, because of the way we store k-mers – in Bloom filters and CountMin sketches. If you try to stuff too many k-mers into these data structures, you will end up swamping the graphs with false positive k-mers. We’ve done some formal as well as some empirical analyses in Pell et al., 2012 and Zhang et al., 2014, but the general rule is that “more memory is better”.
If you’re interested in extracting the estimated false positive rate,
you can do that with calc_expected_collisions, which will give you
the FP rate based on the data structure loading so far:
In [17]:
>>> khmer.calc_expected_collisions(ng)
Out[17]:
0.0028394400664437528
...but the basic version is that for most real analyses, a few gigabytes is more than enough.